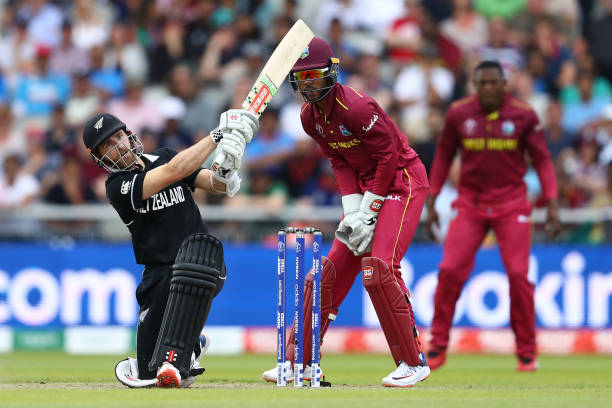
New Zealand is set to play their first international series after a long gap of eight months as they will host West Indies for a three-match T20I series as well as for a two-match Test series at home from 27 November.
Over the years these two nations have played so many competitive series and have produced many memorable moments in all formats of the game and here is a statistical look at their T20I history.
A Statistical look at New Zealand vs West Indies T20I history :
Head to Head in T20I cricket -
| Venue | Match | NZ Won | WI Won | Tied | NR |
| New Zealand | 8 | 5 | 0 | 2 | 1 |
| West Indies | 2 | 1 | 1 | 0 | 0 |
| Neutral | 3 | 0 | 2 | 1 | 0 |
| Overall | 13 | 6 | 3 | 3 | 1 |
Highest Totals -
243/5 - NZ at Mount Maunganui, 2018
209/2 - WI at Lauderhill, 2012
191/9 - NZ at Hamilton, 2008
189/5 - NZ at Auckland, 2014
187/7 - NZ at Nelson, 2017
Lowest Totals -
108/8 - WI at Auckland, 2014
116 - NZ at Lauderhill, 2012
124 - WI at Mount Maunganui, 2018
126/7 - WI at Auckland, 2006
126/8 - NZ at Auckland, 2006
Most Runs -
258 - Chris Gayle
254 - Ross Taylor
250 - Colin Munro
250 - Andre Fletcher
237 - Brendon McCullum
Highest Batting Averages (Min 100 Runs) -
111.0 - Luke Ronchi (111 runs)
50.0 - Colin Munro (250 runs)
42.33 - Ross Taylor (254 runs)
41.66 - Andre Fletcher (250 runs)
36.85 - Chris Gayle (258 runs)
Highest Individual Scores -
104 - Colin Munro at Mount Maunganui, 2018
85* - Chris Gayle at Lauderhill, 2012
67 - Chris Gayle at Auckland, 2008
66 - Colin Munro at Mount Maunganui, 2018
63* - Kieron Pollard at Lauderhill, 2012
Highest Strike Rates (Min 50 Balls faced) -
190.83 - Colin Munro
170.76 - Luke Ronchi
160.65 - Denesh Ramdin
154.20 - Kieron Pollard
152.00 - Dwayne Bravo
Most Fifty Plus Scores -
3 - Colin Munro
3 - Chris Gayle
2 - Andre Fletcher
2 - Brendon McCullum
2 - Ross Taylor
Most Sixes -
17 - Colin Munro
16 - Chris Gayle
13 - Andre Fletcher
11 - Brendon McCullum
10 - Ross Taylor
Most Wickets -
15 - Tim Southee
14 - Sunil Narine
9 - Nathan McCullum
8 - Jerome Taylor
7 - Dough Bracewell
Best Bowling Averages (Min 5 Wickets) -
7.00 - Daniel Vettori (5 wickets)
12.00 - Sunil Narine (14 wickets)
12.11 - Nathan McCullum (9 wickets)
13.16 - Trent Boult (6 wickets)
13.33 - Chris Gayle (6 wickets)
Best Bowling Figures in an innings -
4/12 - Sunil Narine at Lauderhill, 2012
4/24 - Nathan McCullum at Auckland, 2014
3/16 - Daniel Vettori at Auckland, 2008
3/16 - James Neesham at Auckland, 2014
3/20 - Sunil Narine at Pallekele, 2012
Best Economy Rates (Min 10 Overs Bowled) -
5.73 - Nathan McCullum
6.22 - Sunil Narine
6.58 - Trent Boult
6.61 - Samuel Badree
6.66 - James Neesham


