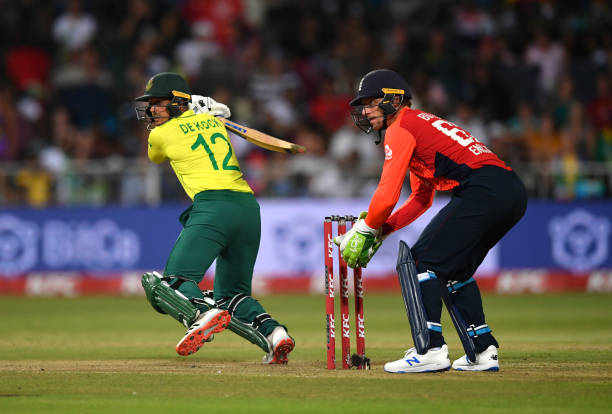
South Africa is set to play their first international series after a long gap of eight months as they will host England for a three-match T20I series as well as for a three-match ODI series in Cape Town from 27 November.
Over the years these two nations have played so many competitive series and have produced many memorable moments in all formats of the game and here is a statistical look at their T20I history.
A Statistical look at South Africa vs England T20I history :
Head to Head in T20I cricket -
| Venue | Match | SA Won | ENG Won | Tied | NR |
| South Africa | 8 | 5 | 3 | 0 | 0 |
| England | 7 | 3 | 3 | 0 | 1 |
| Neutral | 3 | 1 | 2 | 0 | 0 |
| Overall | 18 | 9 | 8 | 0 | 1 |
Highest Totals -
241/6 - SA at Centurion, 2009
230/8 - ENG at Mumbai, 2016
229/4 - SA at Mumbai, 2016
226/5 - ENG at Centurion, 2020
222/6 - SA at Centurion, 2020
Lowest Totals -
111 - ENG at Nottingham, 2009
118/7 - ENG at Chester-le-Street, 2012
129 - SA at Bridgetown, 2010
134/8 - ENG at Cape Town, 2016
135/7 - ENG at Cape Town, 2007
Most Runs -
390 - AB de Villiers (SA)
347 - Eoin Morgan (ENG)
294 - Jos Buttler (ENG)
288 - Hashim Amla (SA)
287 - Jason Roy (ENG)
Highest Batting Averages (Min 100 runs) -
76.00 - Loots Bosman (152 runs)
72.00 - Hashim Amla (288 runs)
72.00 - Jacques Kallis (144 runs)
42.40 - Quinton de Kock (212 runs)
41.66 - Joe Root (125 runs)
Highest Individual Scores -
94 - Loots Bosman (SA) at Centurion, 2009
88 - Graeme Smith (SA) at Centurion, 2009
85* - Eoin Morgan (ENG) at Johannesburg, 2009
83 - Joe Root (ENG) at Mumbai, 2016
78 - Dawid Malan (ENG) at Cardiff, 2017
Highest Batting Strike Rates (Min 50 Balls faced) -
200.0 - Loots Bosman (SA)
179.6 - Quinton de Kock (SA)
171.23 - Joe Root (ENG)
160.49 - AB de Villiers (SA)
160.33 - Jason Roy (ENG)
Most Fifty Plus Scores -
3 - Hashim Amla (SA)
3 - Eoin Morgan (ENG)
3 - AB de Villiers (SA)
Most Sixes -
19 - AB de Villiers (SA)
18 - Eoin Morgan (ENG)
17 - Quinton de Kock (SA)
13 - Jason Roy (ENG)
13 - Jos Buttler (ENG)
13 - Loots Bosman (SA)
Most Wickets -
12 - Chris Jordan (ENG)
10 - Tom Curran (ENG)
9 - Imran Tahir (SA)
9 - Andile Phehlukwayo (SA)
8 - Kyle Abbott (SA)
8 - Graeme Swann (ENG)
8 - Lungi Nigidi (SA)
8 - Dale Steyn (SA)
Best Bowling Averages (Min 5 Wickets) -
12.25 - Kyle Abbott (8 wickets)
12.80 - Dane Paterson (5 wickets)
15.42 - Wayne Parnell (7 wickets)
16.37 - Graeme Swann (8 wickets)
16.42 - Albie Morkel (7 wickets)
Best Bowling Figures in an innings -
4/21 - Imran Tahir (SA) at Cape Town, 2016
4/32 - Dane Paterson (SA) at Cardiff, 2017
3/14 - Wayne Parnell (SA) at Nottingham, 2009
3/23 - Ryan Sidebottom (ENG) at Bridgetown, 2010
3/23 - Chris Jordan (ENG) at Cape Town, 2016
Best Economy Rates (Min 10 Overs bowled) -
6.20 - Johan Botha (SA)
6.55 - Graeme Swann (ENG)
6.60 - Jacques Kallis (SA)
7.04 - James Anderson (ENG)
7.52 - Stuart Broad (ENG)
Most Four Wicket Hauls -
1 - Imran Tahir (SA)
1 - Dane Paterson (SA)


