England who has had a good home season so far is set to take on arch-rival Australia in a three-match T20I series that starts in Southampton tomorrow. Later both sides will also play a three-match ODI series too.
England and Australia's rivalry is known for Test cricket but over the years both sides have been very competitive in limited-overs cricket and they have produced so many good matches and the trend should continue in this series as well. England is in good flow and touch as they have played against Ireland and Pakistan and have the momentum and form too with them.
On the other side, Australia will be playing their first series after a long gap of six months and it will be a tough challenge for them to beat an inform England side in their own backyard. And here is a look at England-Australia's rivalry in T20I cricket.
All the numbers and stats and you need to know about England-Australia's T20I history :
Head to Head in T20I cricket -
| Venue | Mat | Won by ENG | Won by AUS | Tied | NR |
| England | 6 | 4 | 1 | 0 | 1 |
| Australia | 8 | 1 | 7 | 0 | 0 |
| Neutral | 2 | 1 | 1 | 0 | 0 |
| Overall | 16 | 6 | 9 | 0 | 1 |
Highest Totals -
248/6 - AUS at Southampton, 2013
221/5 - AUS at Sydney, 2007
221/5 - ENG at Birmingham, 2018
213/4 - AUS at Hobart, 2014
209/6 - ENG at Southampton, 2013
Lowest Totals -
79 - AUS at Southampton, 2005
111 - ENG at Sydney, 2014
130/9 - ENG at Melbourne, 2014
135 - ENG at Cape Town, 2007
137/7 - ENG at Melbourne, 2018
Most Runs -
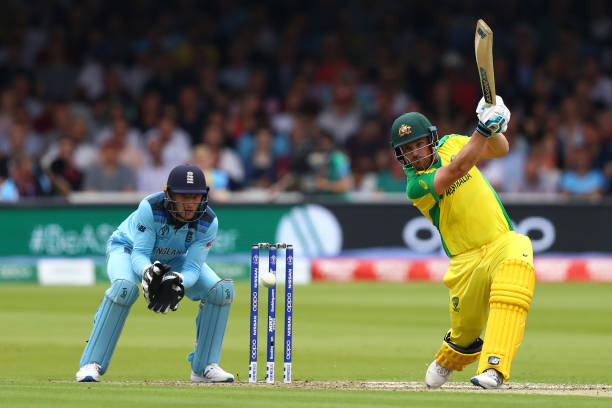
425 - Aaron Finch
305 - Cameron White
260 - Glenn Maxwell
247 - Eoin Morgan
223 - Alex Hales
Highest Individual Scores -
156 - Aaron Finch at Southampton, 2013
103* - Glenn Maxwell at Hobart, 2018
94 - Alex Hales at Chester-le-Street, 2013
90* - Joe Root at Southampton, 2013
90 - Steve Smith at Cardiff, 2015
Highest Averages (Min 150 Runs) -
70.83 - Aaron Finch (425 Runs)
50.83 - Cameron White (305)
46.75 - Joe Root (187)
32.50 - Glenn Maxwell (260)
Most Fifties -
4 - Aaron Finch
3 - Cameron White
1 - 15 other players
Most Wickets -
11 - Mitchell Johnson
8 - Nathan Coulter Nile / Stuart Broad
7 - David Willey / Shane Watson / Jade Dernbach
6 - Glenn Maxwell / Josh Hazlewood / Chris Jordan
5 - Paul Collingwood
Best Bowling Figures in An Innings -
4/15 - Shane Watson at Adelaide, 2011
4/24 - John Lewis at Southampton, 2005
4/30 - Josh Hazlewood at Melbourne, 2014
4/31 - Nathan Coulter Nile at Hobart, 2014
3/10 - Glenn Maxwell at Hobart, 2018
Best Bowling Averages (Min 5 Wickets) -
16.27 - Mitchell Johnson (11 wickets)
17.57 - David Willey (7)
19.00 - Nathan Coulter Nile (8)
19.16 - Glenn Maxwell (6)
19.83 - Josh Hazlewood (6)
Best Economy Rates (Min 10 Overs Bowled) -
5.70 - Mitchell Starc
6.40 - James Muirhead
6.66 - Graeme Swann
6.90 - Ashton Agar
6.90 - Andrew Flintoff


